Your All-Inclusive appliance solution for complete network monitoring

HARDENED APPLIANCE
OPERATING ON LINUX SECURE OPERATING SYSTEM

Reliable Network monitoring
with no additional licensing required
Innovators in Network Monitoring
- Netmon 7.0 is the most revolutionary version of Netmon monitoring ever!
- New hardware appliance and new product features
- New appliance hardware includes updated resources and disk storage to provide for additional log storage
A Single and Powerful Solution
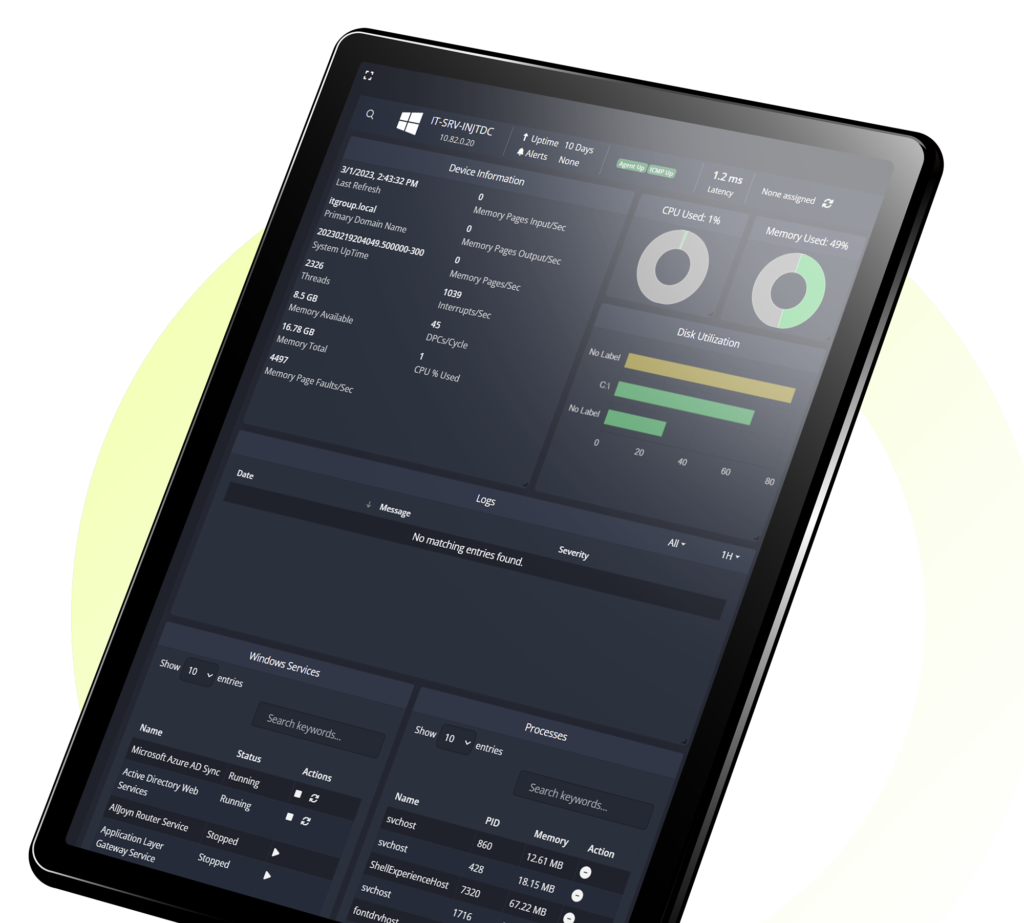
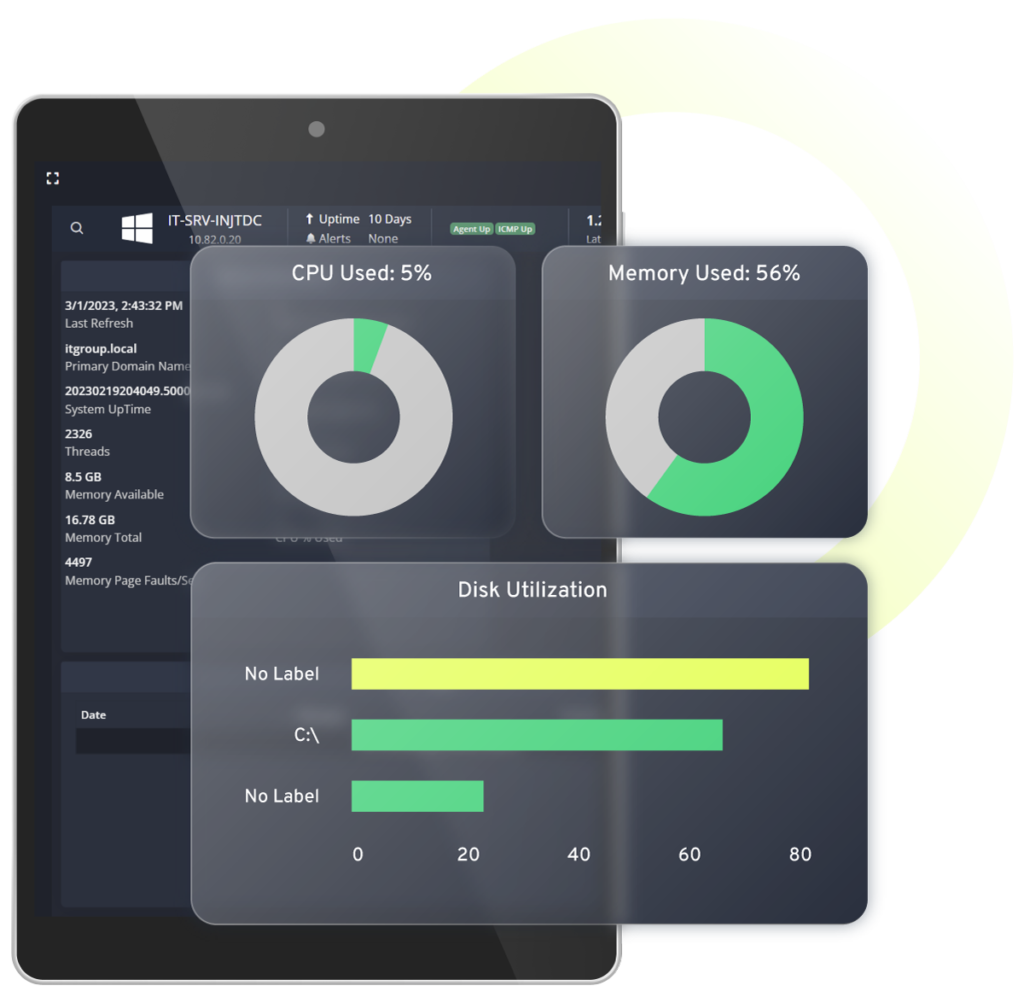
Bundled into a single appliance, the Netmon network monitor offers an inclusive and full-featured network monitoring software system. Monitor your network infrastructure, server performance and network traffic with a SINGLE and POWERFUL SOLUTION.

Unleashing Business Potential: The Power of Network Traffic Monitoring
In the ever-evolving landscape of business, staying ahead requires more than just innovation—it demands a deep understanding of one’s network. Businesses can unlock a realm of benefits by embracing Network Traffic Monitoring, a strategic approach that provides invaluable insights into their digital infrastructure.
Network Traffic Monitoring: Illuminating the Digital Highway
At the core of efficient network management lies Network Traffic Monitoring, a process that involves scrutinizing the flow of data within a network. By implementing a robust Network Monitoring System, businesses gain real-time visibility into their network activities. This proactive approach allows for the swift identification of potential bottlenecks, security threats, or performance issues before they impact operations.
Enhancing Efficiency with Network Performance Management Software
Network Performance Management Software is the key to optimizing a business’s digital ecosystem. By deploying such software, organizations can ensure that their networks operate at peak efficiency. This involves monitoring critical parameters like bandwidth utilization, latency, and uptime, empowering businesses to preemptively address issues that could hamper productivity.
The Dual Impact of Network Monitoring System
Investing in a reliable Network Monitoring System offers a dual impact on businesses. Firstly, it acts as a vigilant guardian, continuously surveilling network traffic for any irregularities. This real-time monitoring is pivotal in identifying and mitigating security threats, ensuring that sensitive data remains safeguarded.
Secondly, a Network Monitoring System contributes to the overall health and performance of the network. By utilizing advanced algorithms and analytics, businesses can gain actionable insights into their network’s behavior. This not only improves operational efficiency but also fosters a proactive approach to network management.
Strategic Deployment for Business Growth
For businesses aiming to thrive in the digital age, strategic deployment of Network Traffic Monitoring, Network Monitoring System, and Network Performance Management Software is paramount. The ability to foresee and address issues in real-time translates into enhanced operational resilience and minimized downtime. This, in turn, cultivates an environment where employees can work seamlessly, customers experience uninterrupted services, and the business thrives.
In conclusion, the benefits of tracking a business’s network extend beyond mere operational oversight. Network Traffic Monitoring, coupled with a robust Network Monitoring System and Network Performance Management Software, empowers businesses to navigate the digital landscape with confidence. By proactively managing their networks, businesses not only fortify their cybersecurity defenses but also pave the way for sustained growth and competitiveness in an increasingly interconnected world.
You’ll Be In Good Company